Some experiments are complex to setup but easy to do, others are in theory simple to attempt but in practice quite time consuming to carry out. This little experiment was not particularly hard to do, but took quite a lot of time to setup and get the images and process the data. Quite a neat result though, so I thought it was worth sharing.
This came about after a discussion on the Ultraviolet Photography forum, about the behaviour of the metal silver in the ultraviolet. Silver should have a strong dip in its reflection curve at around 320nm, as shown here, and it got me wondering whether I could image that with my UV camera setup. Not having loads of silver laying around the house I ordered a couple of sheets of edible silver leaf which is used in cooking, and mounted some on a piece of cardboard.
Imaging wise, I placed the sample in a box painted with Semple Black 3.0 paint to keep the reflections down. I also included a 99% Spectralon diffuse reflectance standard along with it. This was so that I could balance the exposures at different wavelengths and loo for differences in how the silver appeared. Camera was a monochrome converted Nikon d850 from MaxMax, lens was a 105mm UV Rayfact. Filters were a mix of Baader UV/IR for visible light, Thorlabs and Edmund Optics bandpass ones for 390nm to 300nm (along with a Hoya U-340 4mm for the 300nm image as the bandpass filter leaked a bit), and a 254nm bandpass filter from a forensics camera. Light source was a Hamamatsu LC8 200w xenon lamp which I used down to 300nm and a UVP 254nm filter lamp for 254nm. You can see now why it was time consuming.
The images were as follows.
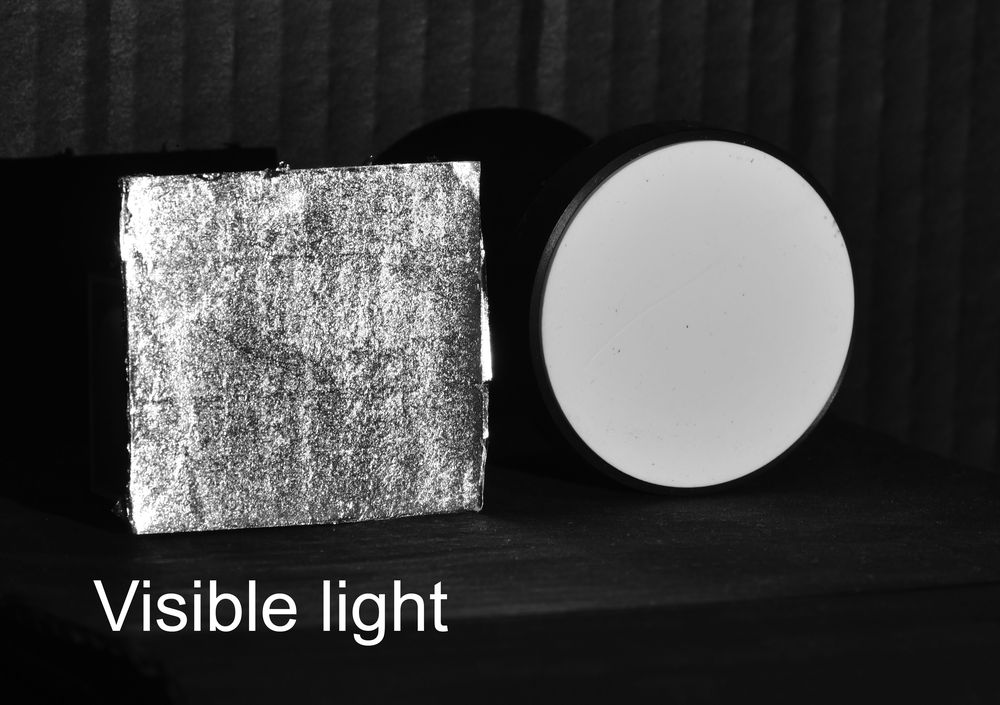
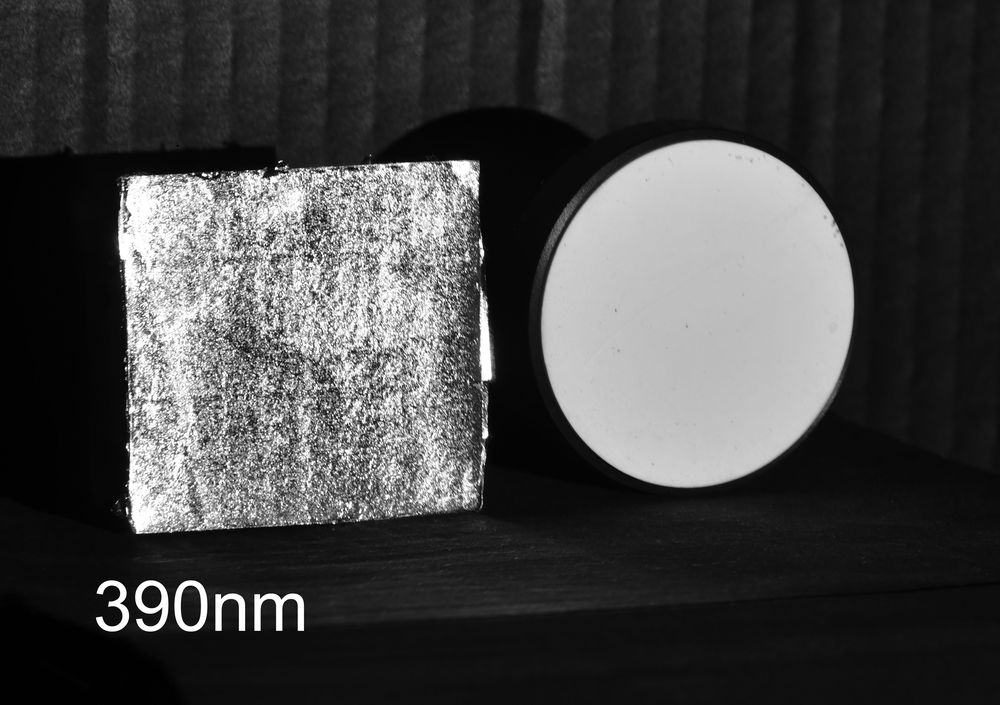


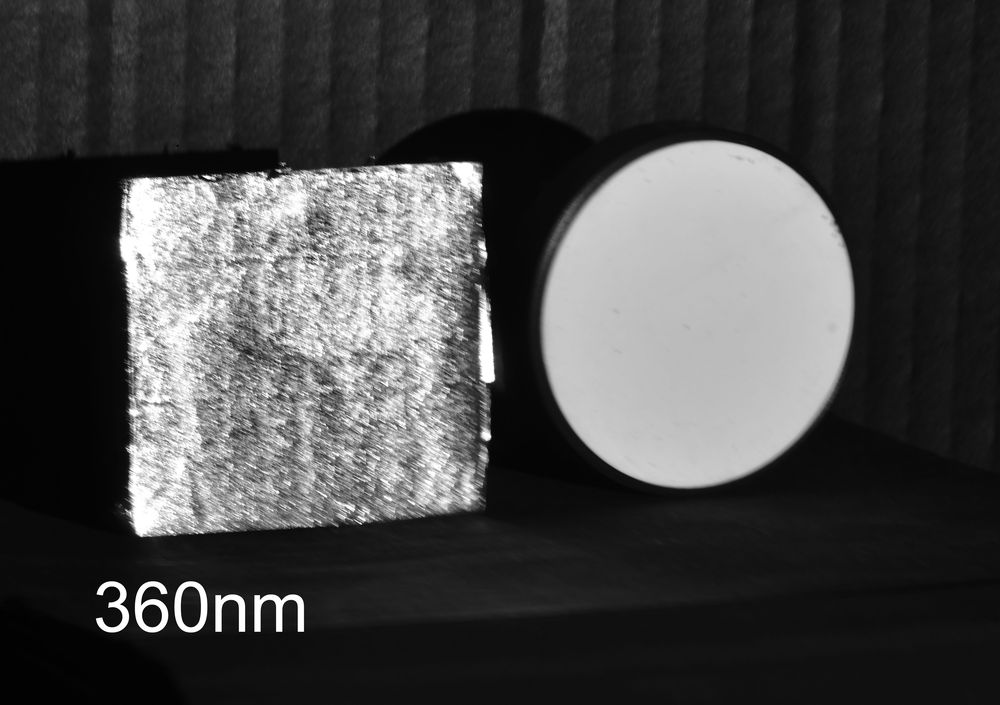

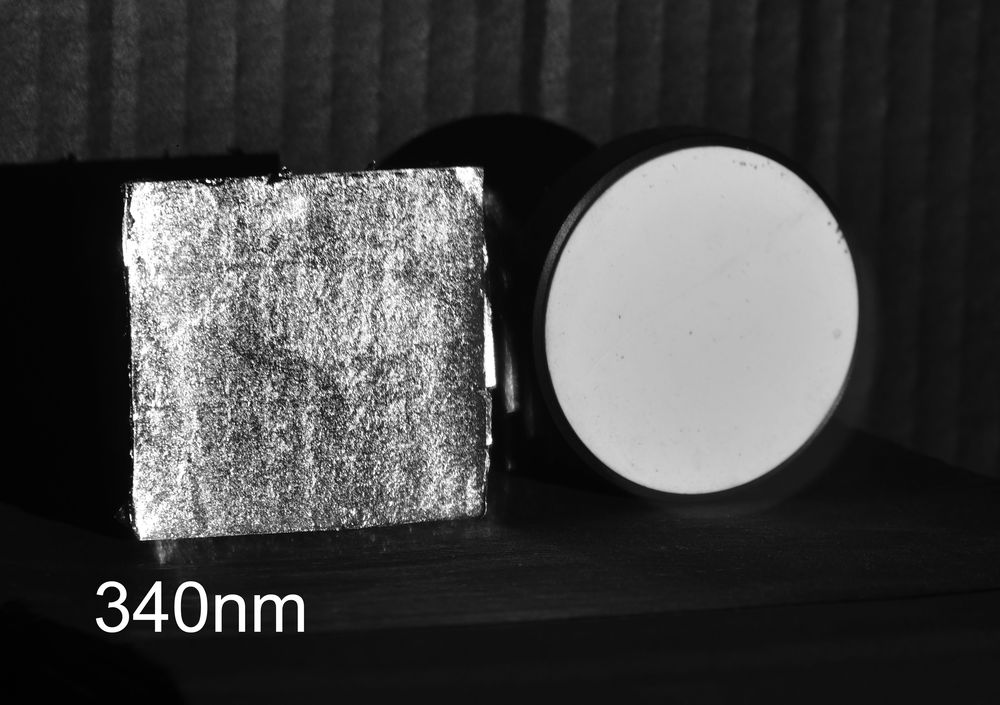
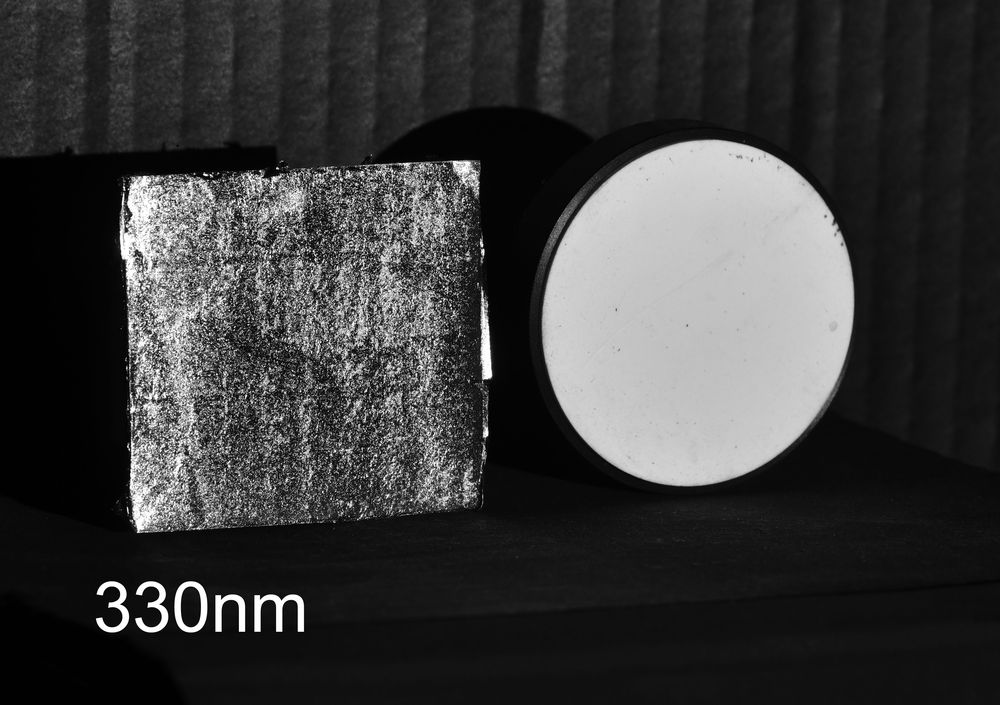

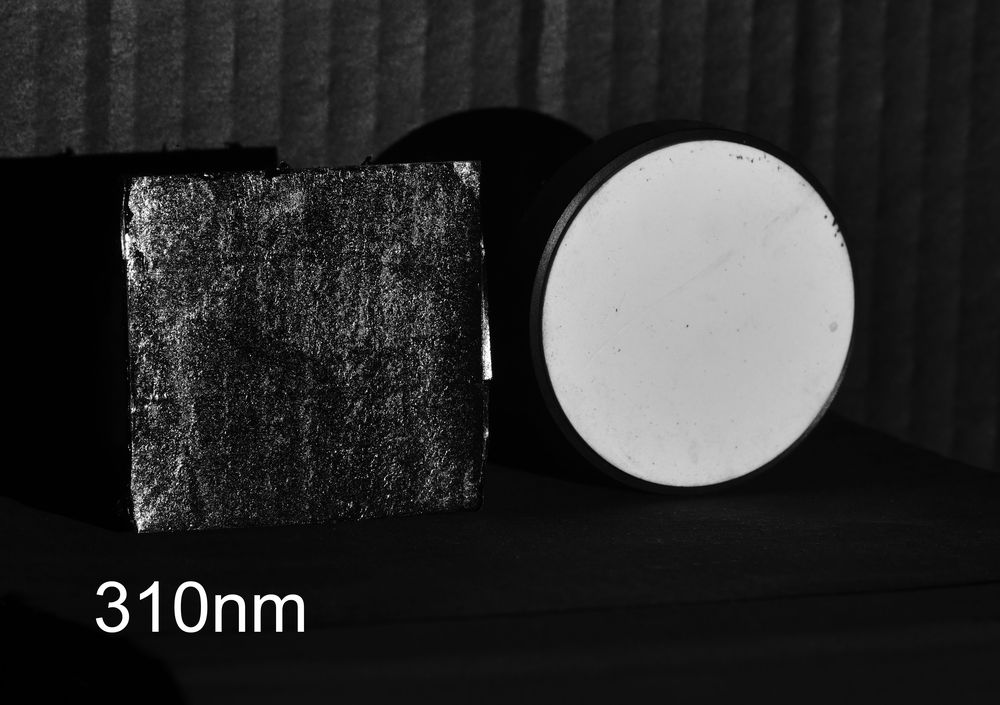
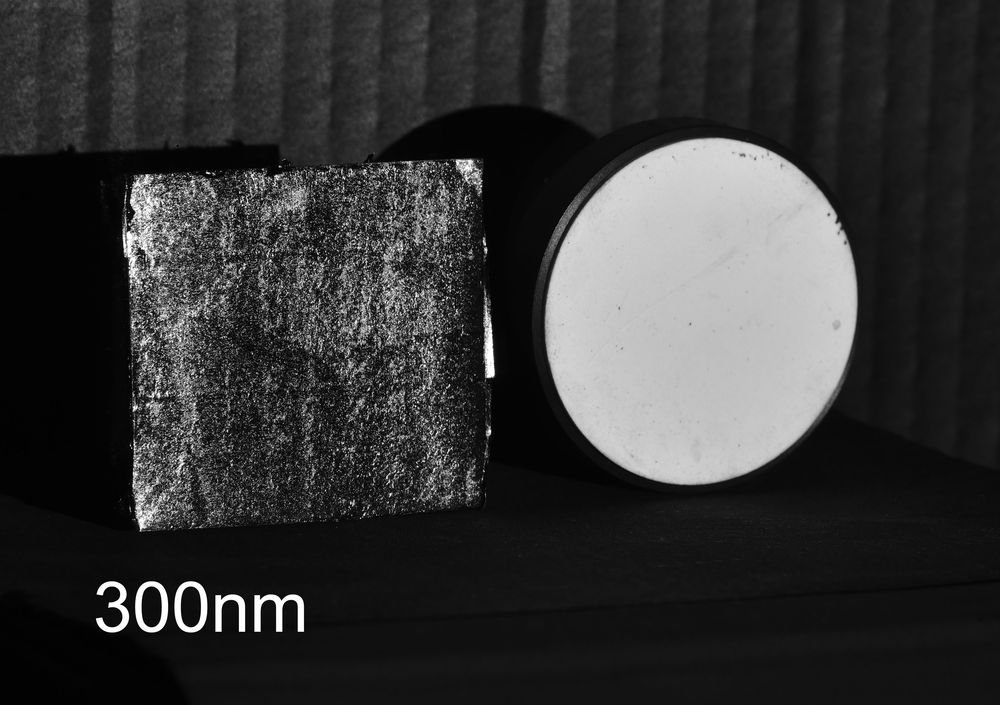
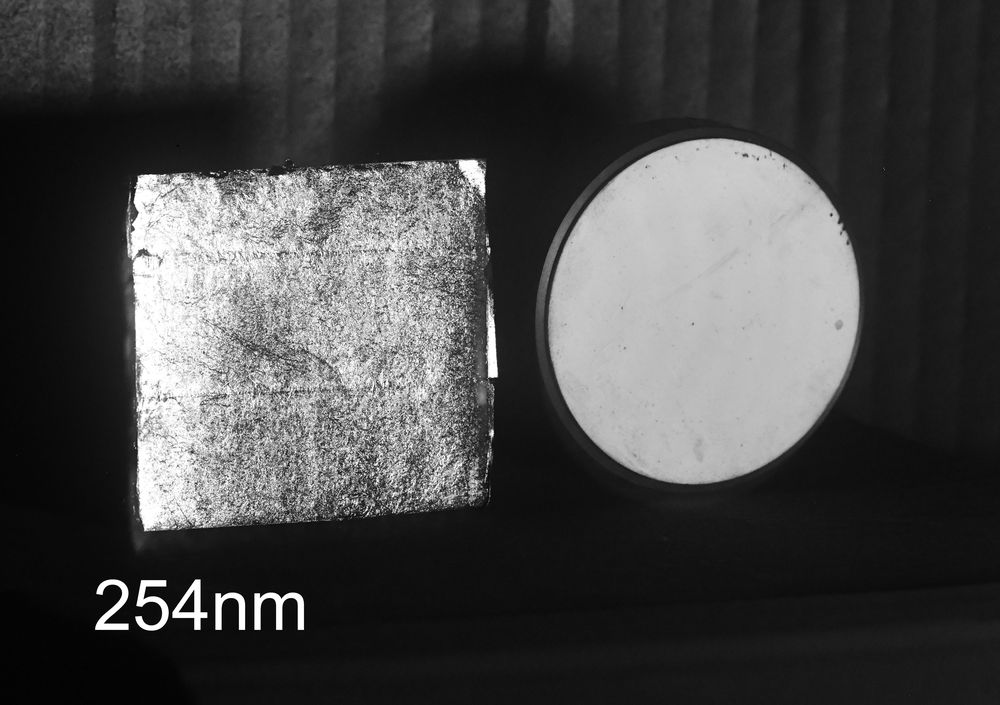
The images did indeed show a very sharp drop in reflectance of the silver at around 320nm. Yay, the images back up the data from the reflectance graph. Good to know the edible silver leaf is indeed silver.
Including the Spectralon standard allowed me to compare the channel response from the silver with that of the Spectralon, and plotting that gave the following.
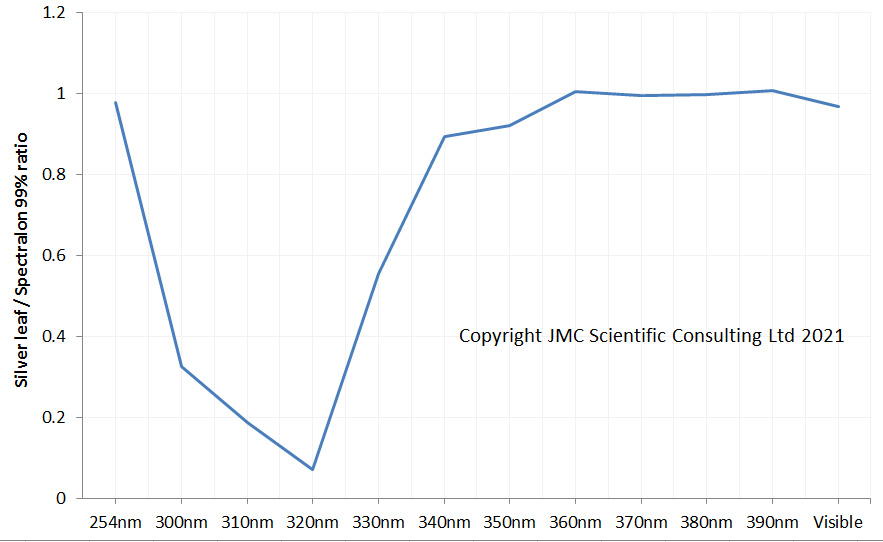
Plotting out the channel response does indeed show the strong dip in reflectance at 320nm and matched the literature data well down to 300nm. At 254nm though the match is not so good, and I am not 100% sure as to why that is. I believe that Spectralon reflectance starts to drop around 250nm, and I know from imaging at 254nm before that any organic material would be highly absorbing at that wavelength. As a result the 254nm image of Spectralon may be darker than it should be as my sample certainly could do with a clean. If this is darker than expected then it would make the silver seem more reflective than it is. It should also be stressed that at 254nm camera sensitivity is extremely low so of all the data points this is the one I am least confident in. More work needed on that from me to understand it better….
Why bother doing this you may ask, why use a camera in this way? Well, that lovely antique you are interested in buying that is supposedly silver, do you really know that it is? This type of technique can be used to check what materials actually are, and can sometimes be simpler to implement than x-ray methods and less damaging to the samples. However my main interest was curiosity – could I use a camera to see the behaviour of silver in the UV trying something to see what will happen. After all, a lot of research starts with a a curious scientist. Thanks for reading, and if you’d like to know more about this or my other work, you can reach me here.