So often it starts with a deceptively simple question. As a small boy I once asked my father why the sky was blue. “Well”, he said, “it’s all about light scattering, and how the various wavelengths of light are scattered differently as they pass through the atmosphere”. I remember listening intently, and understanding about half of what he said, but coming away with a better understanding of what was going on. I then went and looked up the reason, but at least what dad said set me off in the right direction. Very often in science it is the deceptively simple question that is the hardest the answer. This experiment was one of those times…..
Having worked in scientific photography and imaging for a number of years, some thing I’ve always wanted to get a handle on is the spectral response curve for the cameras I was using – basically, how does the camera respond to light of different wavelengths? “Who cares”, you may say, and you are entitled to do that, but if the data you are generating is being used for claims, you want to know as much about your measurement technique as possible. I’ve recently started looking more at UV imaging, and given the camera there is working well outside the wavelength range it was designed for, it is even more important to know what wavelengths of light it is sensitive to.
So I started with a deceptively simple question – “What is the spectral response curve of my camera in the 300nm to 400nm range?”. Easy, surely, someone must have done this. There are a few papers on spectral response measurement, but not in the UV. The approaches were complex and some required maths which was well beyond me. I approached the camera manufacturer directly, only to be told, “no we can’t tell you, this is confidential”. Thanks guys. I even went to a testing house and asked them what it would take to measure a spectral response curve. I was told around £20,000 and 2-3 months. For one camera….. Hmm, maybe not.
Where did this leave me. Well it left me without an answer. Back to the papers, how did they do it? In its simplest form, you need the following; a good light source with plenty of light in the wavelength range of interest, a monochromator, an integrating sphere, a spectrometer, and some way of keeping stray light out. Thankfully I had a light source (Ocean Optics DH-2000-BAL) from another project, along with access to a calibrated spectrometer (Ocean Optics FX). I needed a monochromator with a suitable wavelength range, and an integrating sphere. Neither of which are cheap items. Back to eBay, and a few weeks later I had both for about £400 total, or about 20% of the new price.
First thing to do – how much light does the monochromator let through at the different wavelengths? I had already decided that I wasn’t going to measure light across the whole of the UV and visible spectra, but that I wanted to be able to include some visible wavelengths to compare UV cameras with normal ones. I settled on wanting to know what was going on between 280nm and 480nm in 20nm chunks. This was the first experiment – how much light gets through the monochromator at each wavelength? At least this was straight forward enough, and got me the following curve;
![]()
The monochromator worked (always good to see with a second hand piece of scientific equipment). The light varies quite a bit at the different wavelengths though. Thankfully as I had a calibrated spectrometer, it was easy enough to get from this curve to one for ‘photon flux as a function of wavelength’ which is what I needed for working the spectral sensitivity of the camera.
The integrating sphere was a small 2″ one, with a Spectraflect coating and 4 ports. I only needed 2 (at 90 degrees to each other), and for my work I assumed that the reflectivity did not vary considerably between 280nm and 480nm. In reality it would be a few % difference across the range, but given what I was trying to achieve, I could live with assuming a flat response.
Now the fun part – building the apparatus. I raided the man cave for my finest wood offcuts – the ones which were too nice to make it to the wood burner. Measure twice, cut once, and when you need to position things to a fraction of a mm, you definitely work to that. I needed to position the light coming into the monochromator to within less than a mm to ensure the most light got in. This was a little tricky, as I needed a screw fixing in wood for the collimator to attach to. So I bought fuel hose nut with the right thread pitch, which people normally buy when they are blinging up their engine bays, and glued it into a piece of plywood using JB Weld. Solid as a rock. Lots of sanding, measuring and cutting made the rest. Once the rest of the build was done I painted the inside with Semple 2.0 Black paint, which is incredibly matt and has great absorption down into the UV. It is brilliant for these types of jobs. Here is what I ended up with.
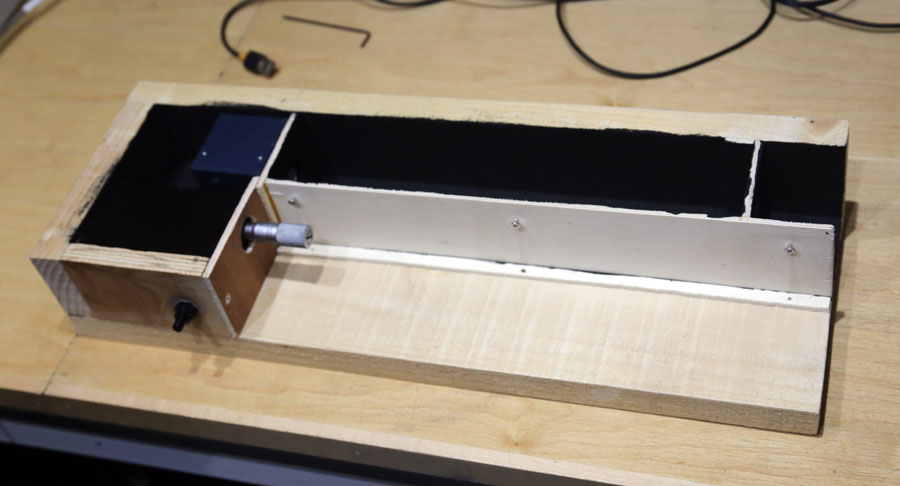
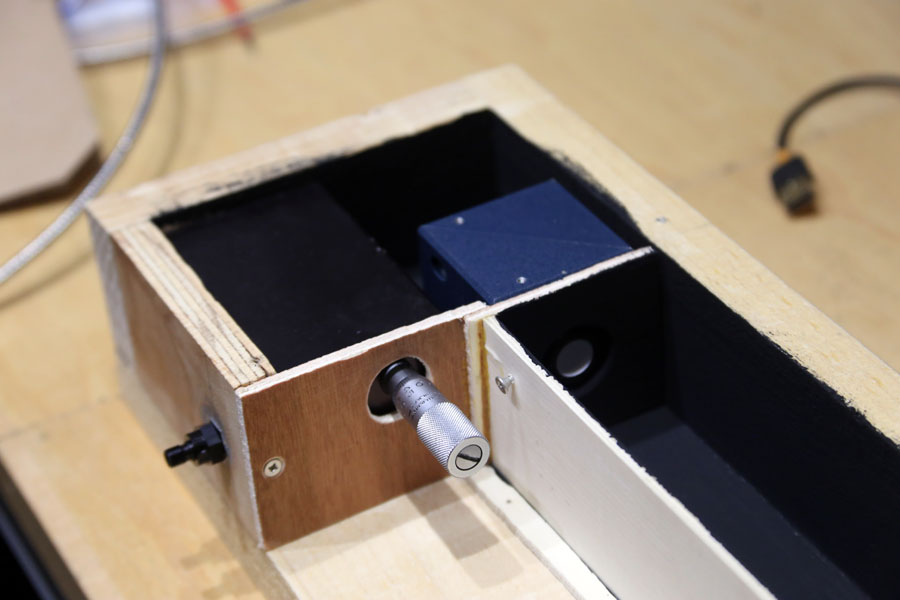
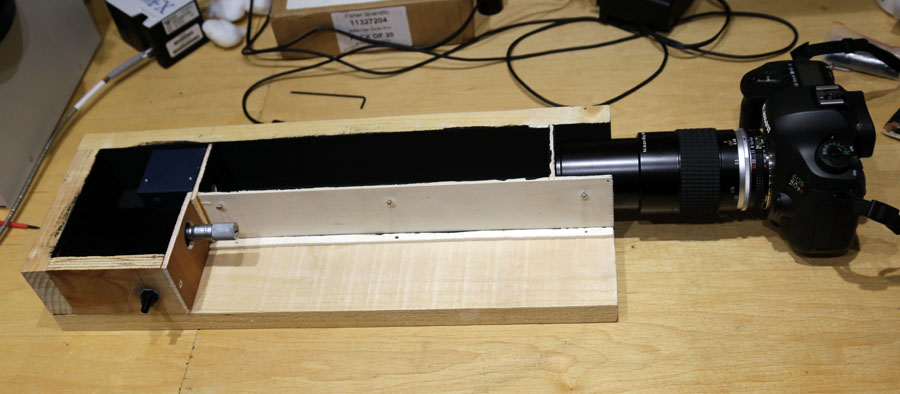
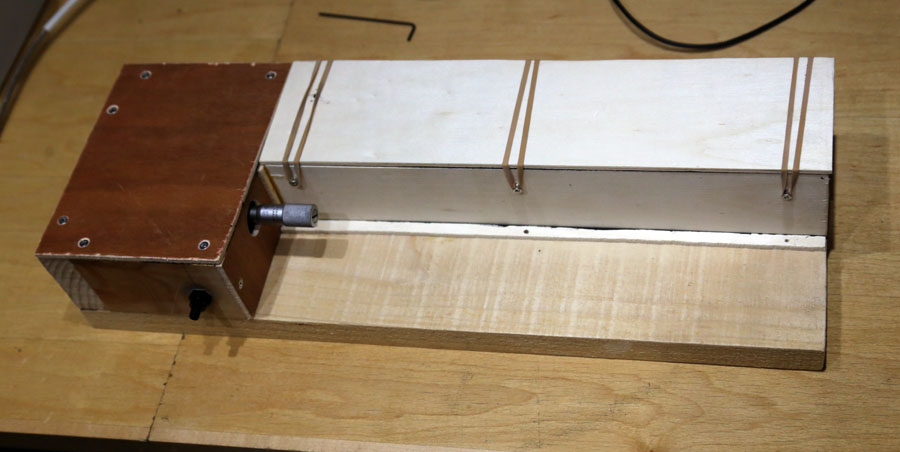
In effect, light comes into the monochromator on the left, then passes through the integrating sphere to give an even circle of light. This then gets imaged by the camera on he right. “Ah”, you ask, “when imaging UV the lens absorbs most of the light, so how do you deal with that?”. This is a Rayfact 105mm UV lens – using CaF2 and quartz optics, and no glass and lets about 70% of the light through from 200nm up to 900nm, so is ideal for UV imaging. Being a Nikon fit lens it is also easy to fit to a Canon with the right adapter.
The moment of truth, does it work? I had to play with the settings on the camera bit, as the integrating sphere robs a lot of light. But after a bit of work I managed to capture images of the light coming from the integrating sphere in a very reproducible manner. I use RAW files, as I didn’t want any in camera processing, and extracted the RGB data to give me the intensity of light. I then use this and light coming through the monochromator at each wavelength to derive a response for the camera. This is not an absolute response, but a relative one – a score of 200 would show it was twice as sensitive as score of 100 for instance. it does however allow me to compare cameras and filters to see the effects.
A simple one to start with. A normal camera used for colour imaging (Canon EOS 5 dsr) and the same model of camera converted to monochrome multispectral imaging by MaxMax. How do they compare;
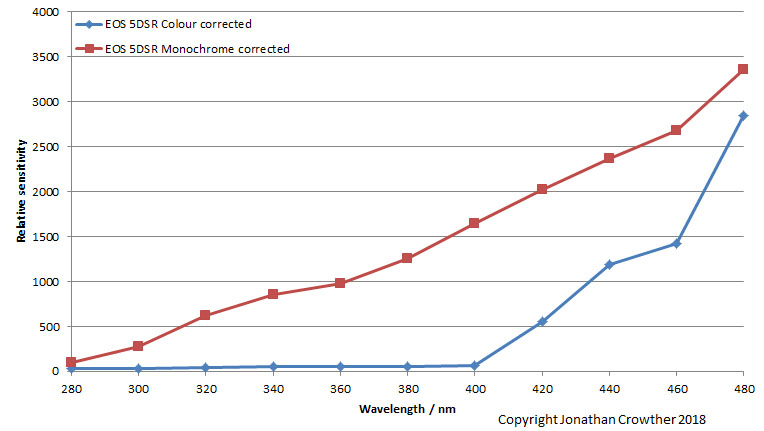
As expected the normal colour camera drops in sensitivity as you go down towards 400nm, and is not sensitive below there. There is a UV and IR blocker in front of the sensor of normal cameras specifically to block UV and IR. This then is telling me what I’d expect to see. What happens with the monochrome multispectral camera? This camera is sensitive to UV, as it has had the UV/IR blocker removed, along with the Bayer filter, so is in essence a raw sensor (other than a Schott WG280 glass filter to protect it). I was told this would be sensitive down to about 300nm, and the data here shows that to be true. It actually remains sensitive down to 280nm, although the sensitivity is dropping of steadily at the shorter wavelengths.
What happens if I add an external UV/IR blocking filter to the front of the lens on the monochrome multispectral camera? I had 2 different ones of these to try – a B&W one and a Baader one. Are they different, or do they behave the same way, and will this be able to see any differences that are there? This is what they looked like when run;
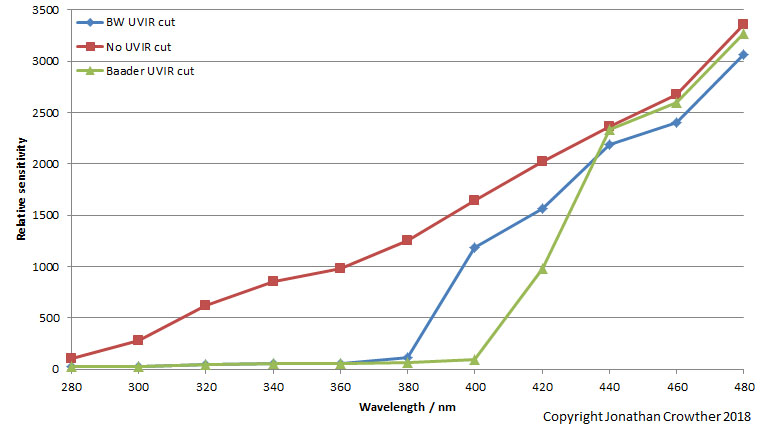
Both UV/IR cut filters did block the UV light, but the B&W one seems to only block below 380nm, so is actually letting some UV light through, and is not acting as efficiently as the Baader one. Also the Baader one is blocking less visible light as it’s curve is closer to the bare lens with no UV/IR cut filter at 440nm and above. The two filters look to be letting light through differently to each other. This is easy to see with a UV transmission spectra measured using a spectrometer;
![]()
The Baader filter does indeed cut out all the UV light whereas the B&W one lets through light down to about 380nm and even a bit below that. The Baader also lets more visible light through beyond 420nm, so overall the Baader one looks to be better at blocking UV and letting visible light through.
Here’s the really geeky part though. Given I have transmission curves for the filters, and I have a spectral response curve for a sensor and lens with no filter, I should be able to model the spectral response curve for the filters. Do my modelled curves match up with the measured ones – always a hard test for a model? Here are the modelled curves compared to the measured ones;
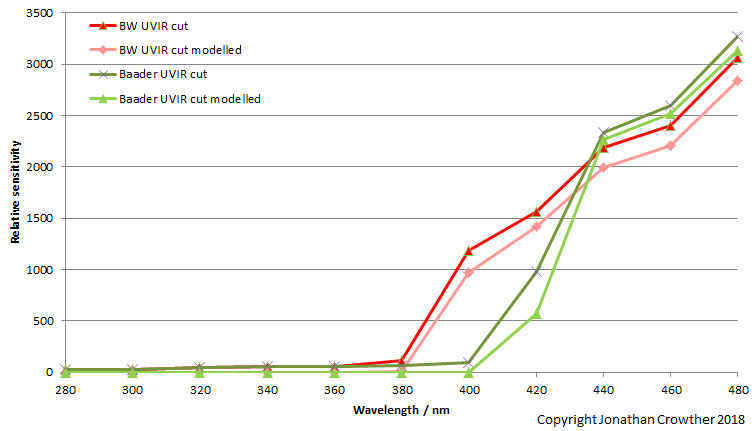
Overall, a pretty good match between the model and reality.
What’s next? I can now assess different cameras, and UV filters. Is one camera better than another at imaging UV for instance? Mainly though it allows me to validate what my UV cameras are seeing – I can now say what wavelengths of light they are sensitive too, and importantly what they are not sensitive to.
This was a great build and a real challenge. It has its assumptions in how the data is handled, but it has passed a difficult test of ‘does the model match the data’, and as such is useful in understanding what is happening. It really pushed me to break down a problem to its component parts and build it back up into a working and testable solution, which was what made it such fun to do. Now I can test a given setup in a few hours using equipment I have access to, rather than the few months I was quoted to have it done for me, making it easy to test different camera/lens combinations.
The moral of this story is beware of deceptively simple questions, as they invariably have less simple solutions…