On the surface it sounds like a simple question – what is the spectral contribution to the photograph I have just taken? Perhaps you want to know how much UV is impacting on your image or it could simply be as simple as wondering whether the lens you are using is suitable for the task at hand and what wavelengths are being emphasized.
Cameras are typically used in combination with filters to block unwanted wavelengths of light, such that only light of the required wavelengths is able to reach the sensor. An example of this would be the UV/IR blocker used in front of most commercial cameras. This blocks UV and IR (sensors are very sensitive to IR) to allow only visible light to reach the sensor. For those of us interested in UV imaging, we look to block visible and IR light and only have UV hit the sensor (easier said than done, but that is a different story….). So when we look for filters for UV imaging there are loads to chose from, depending on the application. Normally in order to understand a filter, you would look at the transmission curve, which plots transmission as a function of wavelength. An example would be like the one below, which shows curves from different thicknesses of U340 filters;
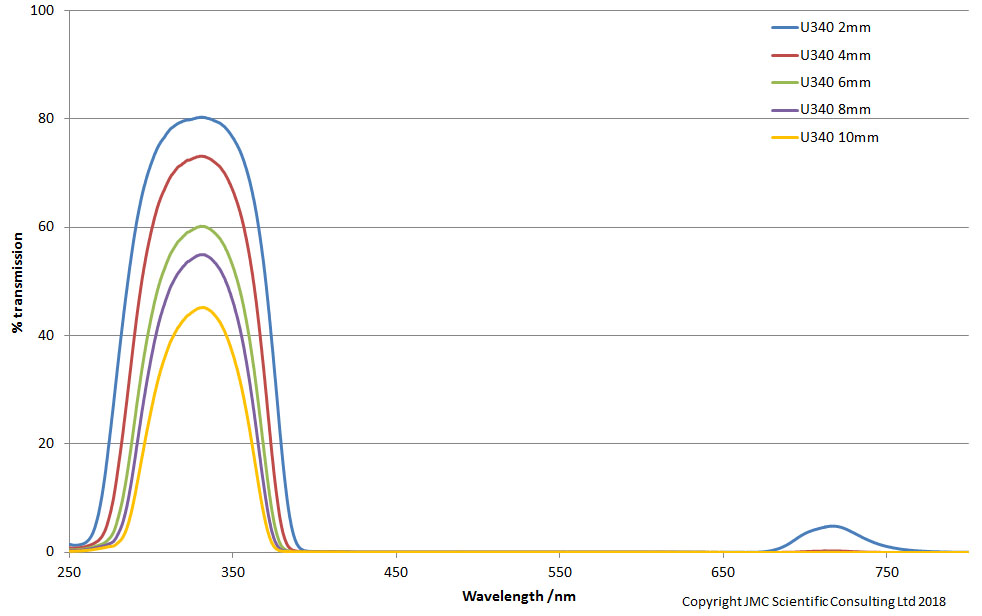
In this example, the U340 has a peak transmission around 330 to 340nm, and lets light through down to 260nm depending on thickness, along with some IR (again the amount depends on the thickness of the filter – the thicker the filter the less the IR gets through).
Very often people will look at these filter charts and use them to select their filters. However there is a problem here with looking at filter charts by themselves, as they present only part of the story. Consider the following;
How does the sensitivity of the camera sensor vary in the wavelength range you are trying to image?
What is your light source – how does the light source intensity vary across the wavelength range you want to look at?
What is your lens transmission characteristics – does it even let through light of the wavelength you want to photograph?
These contributions can have a huge impact on behaviour you may have expected from looking at the filters transmission curve alone, as I will now demonstrate.
Consider this as a thought experiment. I have a camera (Monochrome Multispectral Canon Eos 5DS R), with a Rayfact 105mm UV lens, and want to take UV photos in sunlight. I will focus here on 300nm to 400nm. I have 2 filters to chose from – Baader U and U340 4mm thick – which on the face of it have very different filter transmission spectra. Here’s what the filter profiles look like;
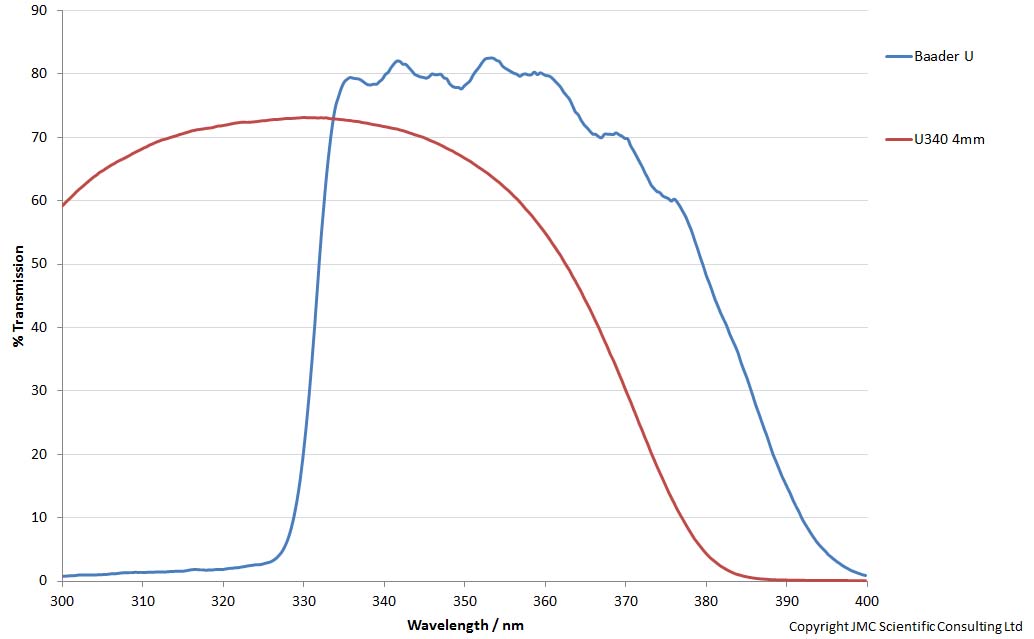
The U340 looks to let more light through at the shorter wavelength end of the UV, and have a substantial contribution still at 300nm, while the Baader U is limited to 330nm to about 380nm.
What does the camera sensitivity look like? I can measure that, and have done in some of the other work in my Techniques section (https://jmcscientificconsulting.com/testing/measuring-camera-spectral-response-uv/). Between 300nm and 400nm this is what the curve looks like;
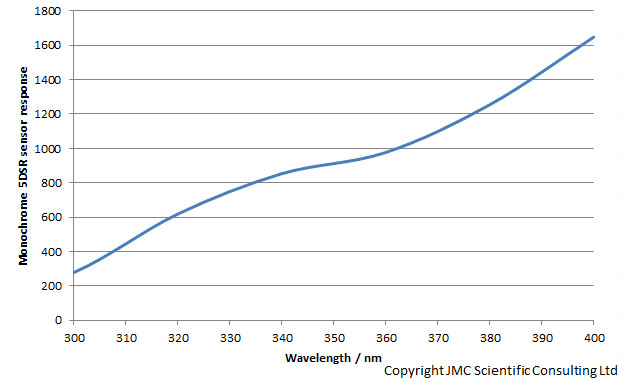
The camera sensitivity drops strongly from 400nm down to 300nm. I have simplified my task here a little by using the Rayfact 105mm UV lens. It has a virtually constant transmission between 300nm and 400nm, but the principle used here can be applied to any lens, as when I measure camera sensitivity it is in combination with a lens. Ok then, next step. What about sunlight, how does that look between 300nm and 400nm? I can measure that and have done with my calibrated Ocean Optics FX spectrometer, and it looks like this;
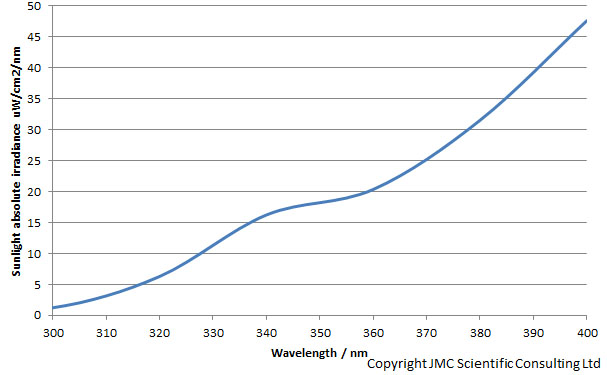
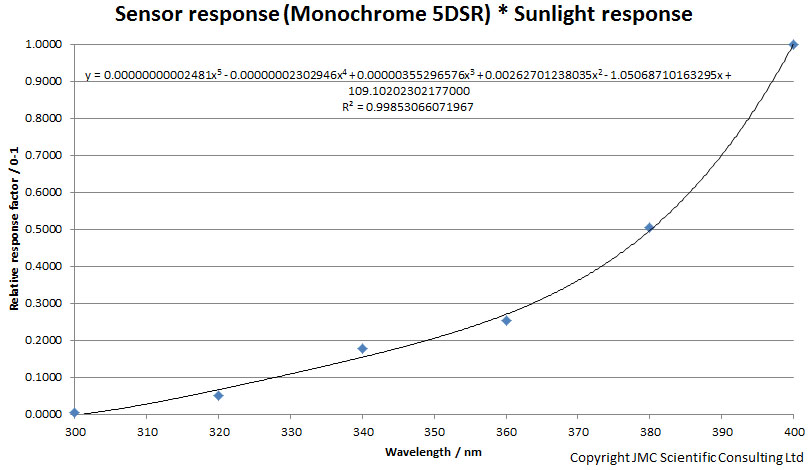
The sunlight intensity drops sharply at shorter wavelengths. When you get down to 300nm there is virtually none left. It is possible to create correction factors for the camera sensitivity and sunlight intensity, simply by normalising these two graphs to their highest values, and scaling them between 0 to 1. Multiplying these factors together gives a correction factor the camera/lens combination and sunlight;
Then the ‘effective’ filter behaviour can be calculated according to the following equation;
Effective filter distribution = filter transmission curve * (sensor correction factor * sunlight correction factor)
When this is multiplied through for the Baader U and U340 filters it gives the following;
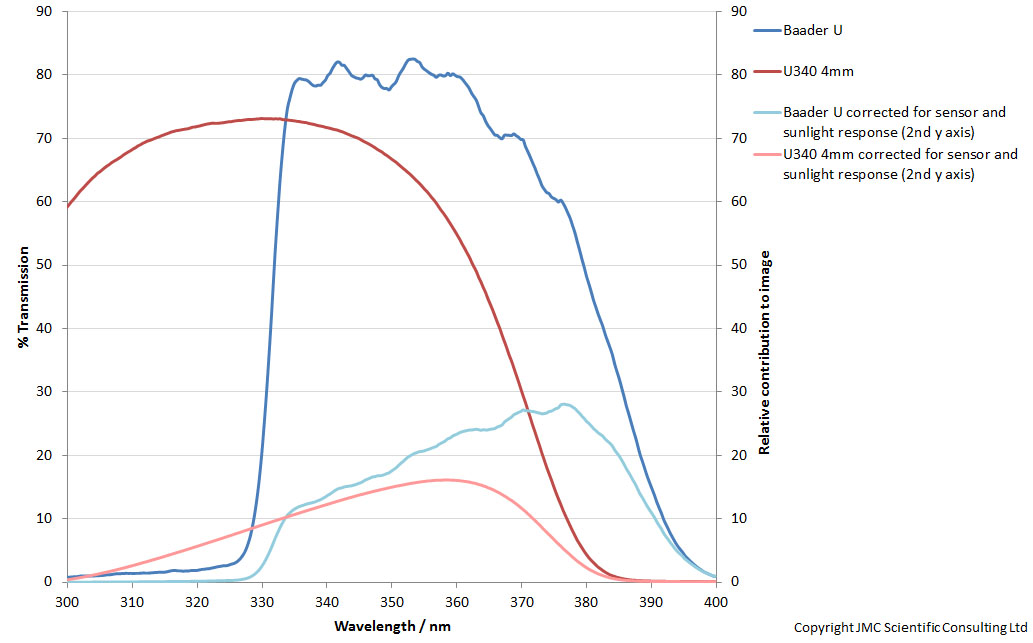
The graph above shows the measured transmission curves for the Baader U and U340 4mm filters, along with their effective transmission curves, corrected for the camera sensitivity and light source spectral distribution (in this case sunlight). The shape of the curves for these 2 filters have been drastically changed by considering the bigger picture. The expected benefit of the huge transmission of the U340 filter at 300nm is in effect lost, because the sunlight has virtually light down there, and the camera sensor has dropped substantially. The Baader U curve is now biased towards the 380nm end and at its maximum is letting through nearly twice as much as the U340 4mm, which is very different to the raw transmission curve.
What’s the lesson here? It is very easy to consider a single criteria when trying to decide on the best course of action in looking for solutions for a problem. However it is often the case that we are dealing with complex systems, where multiple factors have relevance on the problem we are trying to solve. It is only by understanding what’s important to the system you are assessing that you can make informed decisions on solving a problem. Without informed decisions we are simply stabbing the dark….