Measurement of lens transmission in the UV has interested me since I started working with UV photography, and a I’ve ended up building my own system for determining it (see here). However with this setup I was limited to UV and only just getting into the visible, as it could measure from 280nm to 420nm. With recently being in a position to evaluate an Ocean Insight STS-NIR microspectrometer (initial work discussed here) it got me wondering whether I could now measure transmission from 280nm all the way up to 1100nm, as this covers most of the range of camera sensor sensitivity.
To measure lens transmission over such a wide wavelength range meant juggling light source and spectrometer. I ended up using the following combinations;
280nm to 420nm – Hamamatsu LC8 200W xenon light source, Ocean Insight FX spectrometer.
420nm to 650nm – Moritex MHAA-100W halogen light, Ocean Insight FX spectrometer.
650nm to 1100nm – Moritex MHAA-100W halogen light, Ocean Insight STS-NIR spectrometer.
In theory these combinations should have allowed me to see all the way from 280nm to 1100nm. For an initial test I looked at 2 very different camera lenses – Canon 40mm f2.8 STM pancake lens, and a Rayfact 105mm f4.5 UV lens (the modern version of the UV Nikkor 105mm). Here’s how the two lenses looked.
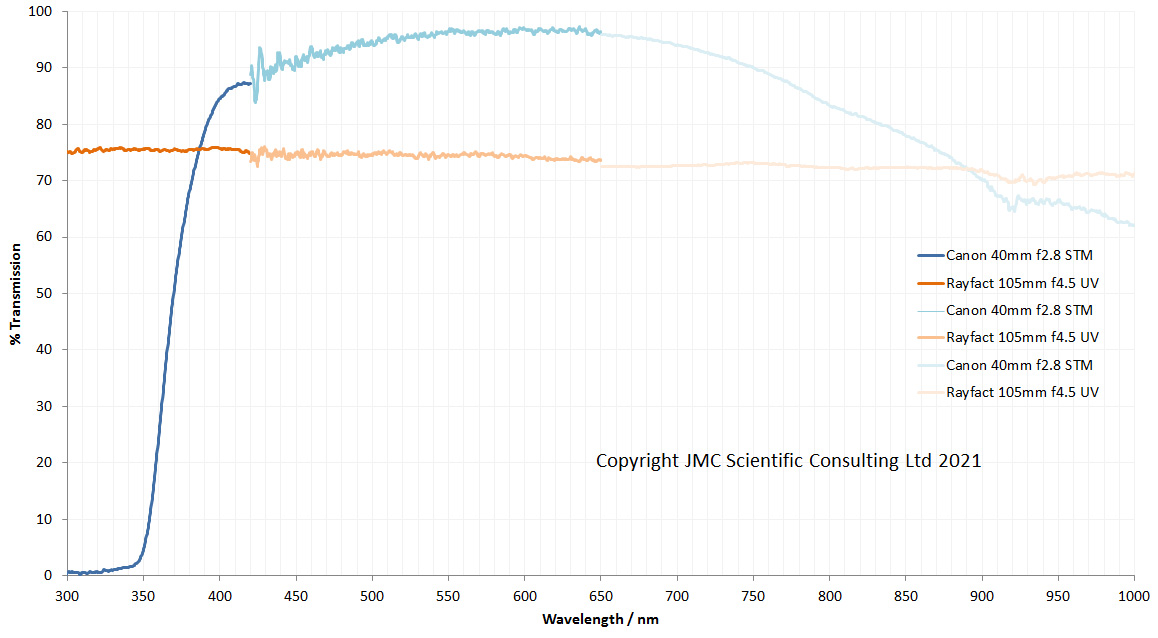
The graph above contains 6 lines – 3 each for the 2 lenses, with each line covering a different spectral range. You’ll notice that the wavelength range only goes to 1000nm, not to 1100nm where the STS-NIR can measure to. This is for a couple of reasons – my Moritex light source light intensity is dropping quickly above 1000nm, and the STS-NIR sensitivity also drops as you get closer to 1100nm. Add these factors together, and then throw in the integrating sphere needed for doing lens transmission measurements and it means that the data gets very noisy above about 1000nm. So I decided that it was only worth plotting it to 1000nm. While I had measurements from 280nm, I started it at 300nm on the graph to make it look prettier – starting at 280nm would make the x-axis scale look odd.
What does this tell us about the 2 lenses? The 2 lenses behave very differently to each other. The Rayfact 105mm f4.5 UV lens has a relatively flat transmission spectrum from 300nm all the way to 1000nm, varying between about 75% at 300nm to about 70% at 1000nm. This is actually pretty close to the data Rayfact share for the lens, which starts at about 78% at 300nm and drops to about 70% at 900nm. The Canon 40mm f2.8 STM pancake lens is very different. It very effectively blocks the light below 350nm, but in the visible region has very good transmission – up above 90% for most of the visible spectrum. Its transmission then drops quickly in the IR as the wavelength increases. This is not surprising, as understandably the Canon lens is optimized for imaging in the visible spectrum. The visible spectrum data is a bit noisier than I expected, especially towards 420nm. Longer acquisition times would help there.
What have I learned here? With the light sources and spectrometers I have I can measure lens transmission from deep in the UV all the way up to the IR. Sensitivity at the top end is lacking a bit which limits me to about 1000nm, although I have a couple of ideas about how to address that in the future. Lens alignment is critical for the measurements here. My setup is horizontal and to get the most accurate results I need to make a stand for each lens to be tested to hold it in exactly the right position for all the measurements. With a vertical setup this would be easier, but at the moment I have no way of safely positioning my lights in a vertical orientation, so horizontal it is for now.
Thanks for reading and if you’d like to know more about this or any other aspect of my work, I can be reached here.